Documentation
Table of Contents
The Rolling Stylometry Explorer is a web application to visualize rolling.classify results in the analyzed text. It was developed as a tool for use with the stylo R library by the Computational Stylistics Group.
1. Quickstart
delete.pronouns to FALSE. Under corpus.lang you can set the language. Then
insert the desired MFW-range under mfw in seq(from=100, to=200, by=100). Adjust all further settings in
the rolling.classify() function. Example
delete.pronouns = FALSE
corpus.lang = "English.all"
for (mfw in seq(from=4000, to=5000, by=100)) {
result = rolling.classify(analyzed.features = "c", ngram.size = 3, mfw=mfw, slice.size = 5000, slice.overlap = 4500,
classification.method = "svm", delete.pronouns=delete.pronouns, corpus.lang=corpus.lang)Rscript --vanilla create_json_rolling.classify. The analysis in Stylo is
performed and the JSON file is generatednpx ts-node json-consolidate.ts
file_path_to_JSON_goes_here.ts
. Add the file path to the JSON file(s). Follow the further instructions in the shell to provide information
about the configurations, the analyzed text and possible authors. json-consolidate will then generate a
output.json file.
npm install rolling-classify-visualizer
), import it in your Javascript
(
import 'rolling-classify-visualizer';
) and add the custom html-Tag to your website (see example below)
- or just try it out here.
<stylo-explorer
  book="/assets/analysis/book.txt"
  classification="/assets/analysis/output.json"
></stylo-explorer>
<script src="/assets/js/rolling-classify-visualizer.js"></script>

You can perform multiple analyses and pass multiple JSON files to the Explorer. Repeat step 3 for every analysis you want to add to the Rolling Stylomentry Explorer. Add the file paths when you execute json-consolidate.ts
 Warning
The Stylo Explorer has only been tested and optimised with the language settings English, English.contr and English.all.

2. Rolling Stylometry Explorer
The Rolling Stylometry Explorer is a web application to visualize rolling.classify results in the analyzed text.
It was developed as a tool for use with the stylo R
library by the Computational Stylistics
Group.
Key Features
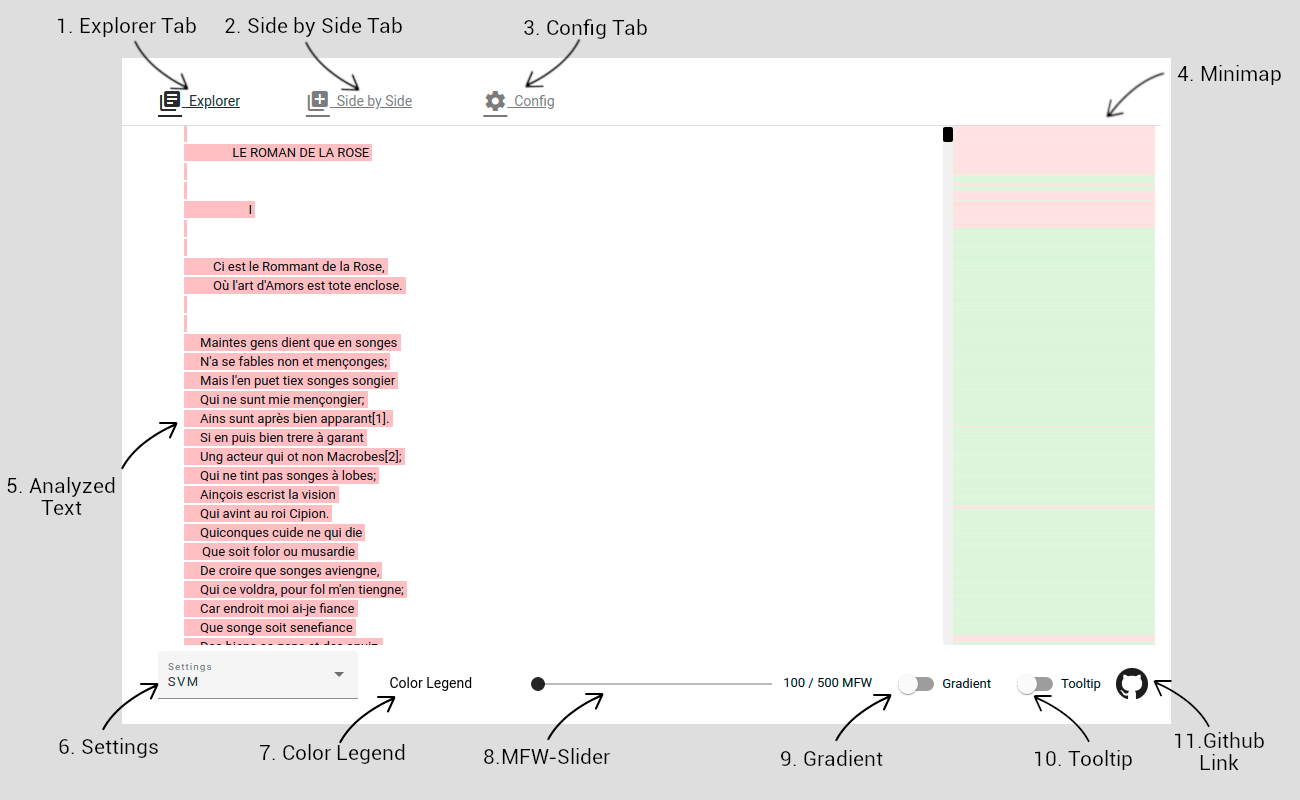
Stylo Explorer Overview

- 1. Explorer Tab: Tab "Explorer" - you are here
- 2. Config Tab: Click on the Tab "Config" to switch to the Config-Site
- 3. Side by Side Tab: Click on the Tab "Side by Side" to switch to the Side by Side View
- 4. Minimap: Minimap based on the Stylo Plot. Shows current position in the text and assignment to
author
- 5. Analyzed Text
- 6. Settings: Switch between different analyses by choosing a setting in the Drop-Down menu in the toolbar
- 7. Color Legend: Click to display the legend for the colors
- 8. MFW-Slider: To change the MFW value and switch to another analysis, just move the MFW slider to the desired MFW value
- 9. Gradient: Switch the toggle switch to display the degree of confidence of the assignment in the text
- 10. Tooltip: Switch the toggle switch to show the probabilities for each author in each text section (just hover over the text section)
- 11. Github Link: Link to the projects Github page
- Short name for JSON file? (Name of the analysis used in Settings and Config)
- What settings have been used for "classification.json"? (This information is displayed under Config)
- What is the full name of the author? (This information is displayed under Config)
- What is the title of the analyzed text / book? (This information is displayed under Config)
- In which year was the text published? (This information is displayed under Config)

Rolling.classify performs a windowing procedure and divides the text into short, overlapping sections. Stylo uses a machine-learning algorithm to train a classifier to assign text sections to individual authors in rolling.classify. The Rolling Stylometry Explorer divides the text into the same sections as rolling.classify. The assignment made by rolling.classify is then made visible in the text by color highlighting. Each author is assigned a color. The most probable author for the corresponding text section is determined using the probabilities calculated by rolling.classify.

2.1. Minimap
The Minimap is oriented in its presentation form to the plot generated by stylo for the respective analysis. It can be read like the plot generated by stylo and shows the assignment in the course of the text, thus providing an overview of the result of the analysis. The Minimap can also be used to navigate through the text. By dragging to or clicking on a position in the Minimap the text navigates to the corresponding position.
 How it works
To create the Minimap we divide the height of the Minimap, which is determined by the size of the browser window by the number of text segments. We then insert bars into the Minimap, the dimensions of which correspond to the result of the division. These bars represent the text segments and are coloured according to the assignment to authors made by stylo. If the Minimap is clicked to navigate to the corresponding position in the text, the system checks which position was clicked on as a percentage of the Minimap. In the text, it jumps to this percentage position. This procedure also applies to dragging within the Minimap.
Marker Minimap
In Stylo you can use xmilestone to insert markers into the text, for example to show the beginning of a chapter, which can be found later in the plot. If such markers have been inserted, they will also be displayed in the Minimap.

2.2. Settings
In the Rolling Stylometry Explorer you can view the analyses for different settings. For example, you can switch between analyses that use different algorithms. A setting refers to all parameters set in Stylo R, except the MFW value. To switch to another analysis, simply click on Settings in the menu at the bottom of the page. Then select the desired setting for the analysis from the drop-down menu. To change the MFW-Value see MFW-Slider.
 How it works
The different settings are passed via the JSON file. From the information given to name the settings, the displayed names for these settings are derived.

2.3. Color Legend
Stylo R assigns a color to each author. This color is used in the plot. The Rolling Stylometry Explorer uses the same colors as Stylo to display the authorship determined by Stylo in the text by color highlighting.To display the legend for the colors just click on Color Legend in the menu at the bottom of the page.

 How it works
Stylo uses a fixed color palette in its default settings. This color palette has been adopted for the Rolling Stylometry Explorer. Stylo assigns each author a color from this color palette. The Explorer uses the same assignment procedure and can therefore always make the same assignment as Stylo.
 Warning
The Rolling Stylometry Explorer works with the color palette selected in the default settings of Stylo. If the colours in Stylo R have been changed with the function assign.plot.colors, the Explorer will still use the standard colour palette. In this case the color legend.

2.4. MFW-Slider
If several analyses with different MFW values were performed within a setting, it is possible to switch between the analyses using the MFW slider. Simply move the MFW slider at the bottom of the screen to the desired MFW value. This value is displayed in a thumb above the slider and next to the slider.
 How it works
The analyses with the different MFW settings are transferred via the JSON file. Each position of the MFW slider is assigned to a MFW value and thus to an analysis. If the slider is moved to a new value, the corresponding analysis is loaded into the explorer.

2.5. Gradient
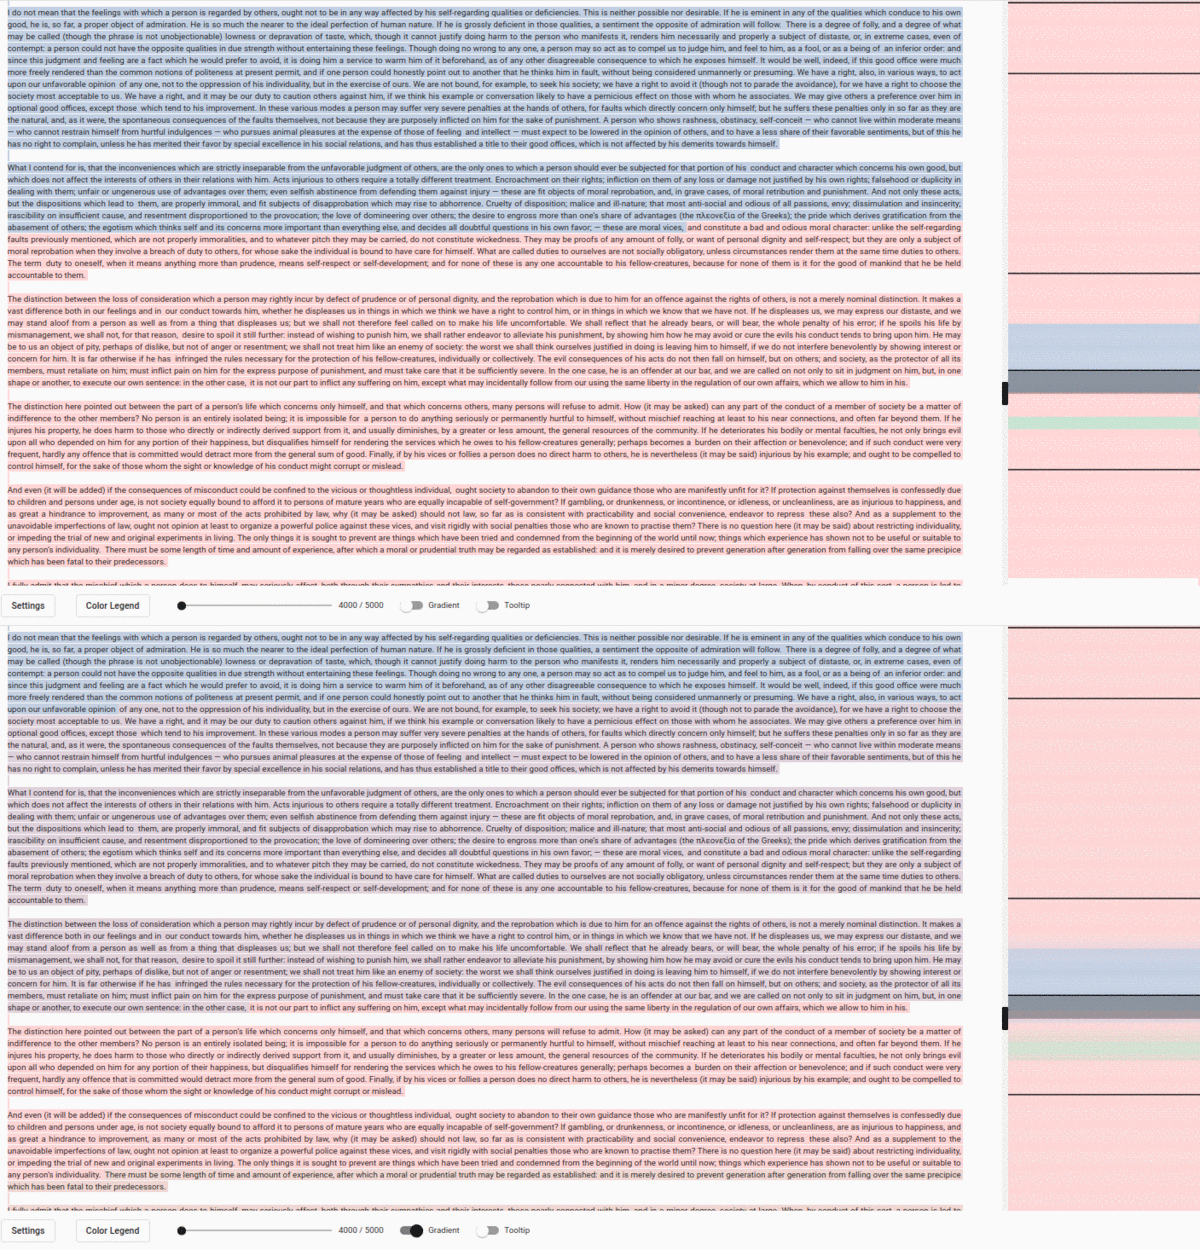
The gradient feature allows you to display the degree of confidence of the assignment in the text. To activate the function, switch the toggle switch in the settings menu at the bottom of the page.
 How it works
Each author is assigned a color (see Color Legend). According to the probability calculated by stylo, the colors of the authors are mixed and the respective text section is colored in the color thus created. The weighting of the colours is the average value of all available results for the text section, which are then being normalized.
 Warning
The gradient feature does not yet work reliably with SVM analyses. We are working on it :)


2.6. Tooltip
With the tooltip feature you can display the probabilities output by stylo for the assignment of the authorship. Just activate the toggle switch "Tooltip" and hover with the mouse over a text section. A window with the values for each author will appear.

The values displayed by the Explorer are not normalised.

 How it works
You can make Stylo R save the calculated probabilities by storing the result of the analysis in a variable. These values are saved in the JSON file and passed to the Explorer. The Explorer uses this data to load the exact values for each text section.


3. Side-by-Side
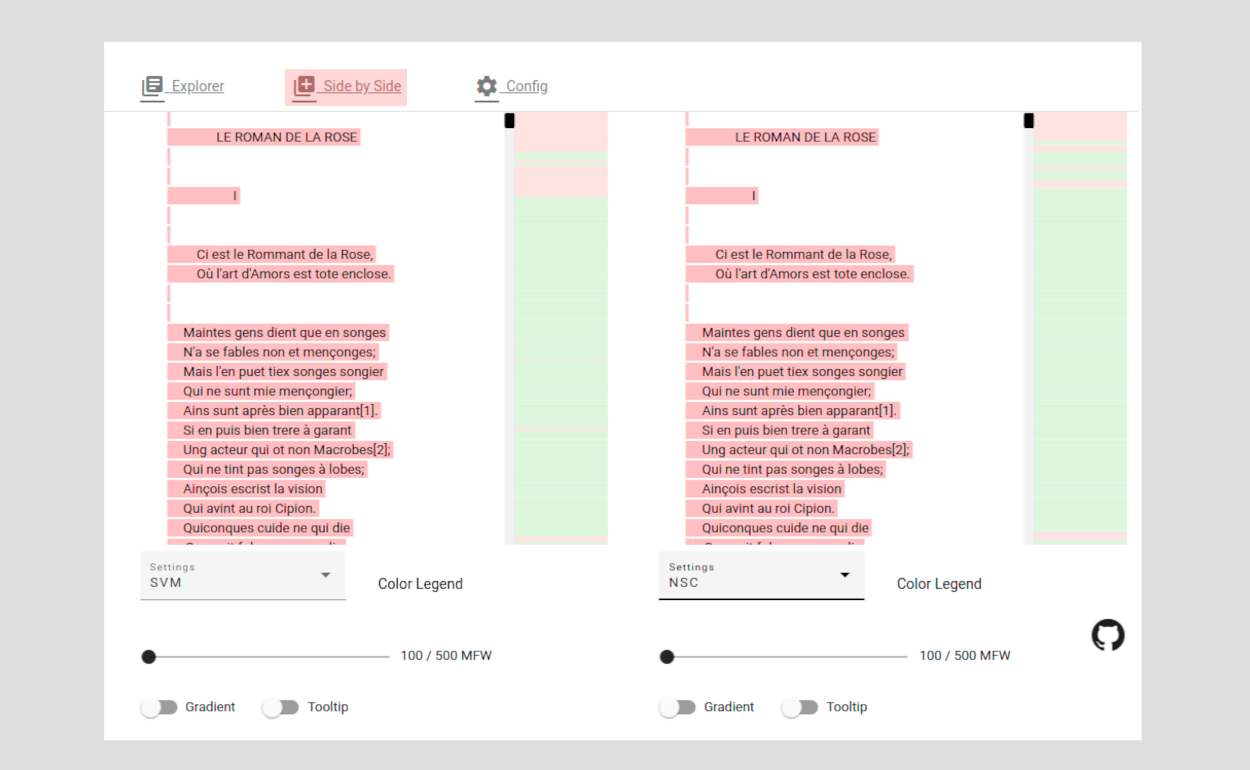
The side-by-side feature allows two analyses to be viewed and compared side by side. If you select the tab "Side-by-Side", you will see two analyses. You can select the settings for each analysis in the menu at the bottom of the page. The interface is structured analogous to the interface of the regular explorer. The scrolling of the two windows is synchronised, which should make the comparison easier.


For the side-by-side feature, two Rolling Stylometry Explorer are displayed next to each other. Both explorers access the same database and therefore contain the same book.txt file and the same JSON file. Otherwise, the explorers are independent of each other and separate settings can be made for each.

4. Config
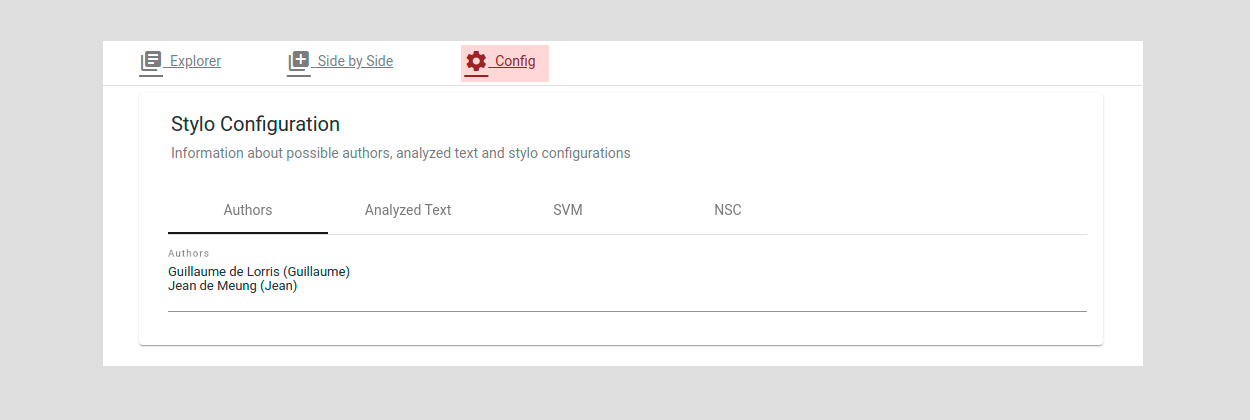
During setup, you can provide information about the text, the authors and the different analyses. This information can be viewed under Config. To get to the Config section, simply select the tab Config in the menu at the top. In the Config area you will find under Author the information you provided about the authors and under Analyzed Text the information about the analyzed text. Additionally, there are tabs named after the individual analyses. Here you can find the information about the different implemented analyses.


In the step in which you transfer your analyses to the Rolling Stylometry Explorer, you also can pass further information. You will be prompted to do so from the command line. The following input requests will appear:
The passed information is transferred with the JSON file to the Explorer and used to name the analysis / to fill the Config page with information.
